Crypto Continuation Patterns: Flags, Pennants & More
Crypto loves fake certainty. One candle looks like the trend is dead, then the next one wipes out that fear and sends price right back in the same direction.
Crypto continuation patterns can help you tell the difference. They help you read the pause between big moves instead of reacting to every pullback, wick, or sideways stretch. They don’t predict the future, but they give you a cleaner way to judge whether momentum is resting—or breaking down.
What Are Continuation Patterns in Crypto?
Continuation patterns are chart patterns that form when price pauses inside an existing market trend. They usually appear after a strong move, during a period of price consolidation, and suggest that the initial trend may resume once price exits the structure.
In technical analysis, continuation chart patterns help you separate a normal pause from a possible reversal. They’re represented on a candlestick chart, where price action forms recognizable shapes such as flags, pennants, triangles, and rectangles.
These patterns aren’t inherently bullish. A bullish continuation pattern forms in an uptrend and points to a possible move higher. A bearish continuation pattern forms in a downtrend and points to a possible move lower.
What Continuation Patterns Can and Cannot Tell You
A continuation pattern suggests that the prevailing trend may continue, but it doesn’t guarantee anything. It shows that the market has paused, compressed, or moved sideways after a strong move.
The pattern only becomes useful when price breaks beyond a clear boundary. Until then, it’s just a structure on the price chart. Shape alone can’t confirm direction, and crypto chart patterns can fail quickly when volatility, leverage, or news takes over.
The Market Logic Behind Continuation Patterns
Most continuation patterns follow the same basic sequence: trend, impulse move, consolidation, then breakout or breakdown.
Prior Trend: The Non-Negotiable Starting Point
A continuation pattern needs a meaningful prior trend. Without one, the setup has nothing to continue. If price moves sideways after a weak or choppy previous trend, don’t force the label. A clean strong trend gives the pattern a better foundation and makes the next signal easier to interpret.
Impulse Move: The First Strong Push
Before a flag pattern, pennant pattern, or many triangle setups form, price usually makes a sharp move up or down. This first push is the impulse move. In flags and pennants, that move is also called the flagpole. It gives the setup its directional bias and often helps you estimate a possible measured move target later.
Consolidation: When the Market Catches Its Breath
After the impulse, price slows down. It may drift sideways, pull back slightly, or compress between trend lines. This pause doesn’t automatically mean reversal. It shows a temporary balance between buyers and sellers while the market absorbs the earlier price movement.
Breakout or Breakdown: The Moment of Confirmation
A bullish continuation setup confirms when price breaks above resistance or the upper pattern boundary. A bearish continuation setup confirms when price breaks below support or the lower boundary. You want a decisive candle close, not just a wick. A close beyond the breakout point gives stronger breakout confirmation than a quick spike that fades immediately.
False Breakout: When the Pattern Fails
False breakouts happen when price briefly moves beyond a pattern boundary and then snaps back inside the range. They’re common in volatile crypto markets, especially when breakout volume is weak. A false breakout invalidates the signal and can trap early entries. Volume confirmation, candle closes, and disciplined stop-loss placement help reduce that risk.
Learn more: Best Indicators for Crypto Breakouts
Bullish vs. Bearish Continuation Patterns
Bullish continuation and bearish continuation patterns follow the same logic in opposite directions. Both form after a pause in the trend, and both need confirmation before you act.
The difference comes from the prevailing trend and the breakout direction. In an uptrend, you look for continuation higher. In a bearish trend, you look for continuation lower.
Bullish Continuation in an Uptrend
Bullish continuation patterns form when price trends upward, pauses, then breaks upward again. A bullish flag, bullish pennant, ascending triangle pattern, or bullish rectangle can all fit this idea.
These patterns show that buyers may still control the broader trend direction. Still, you need price breaks above resistance levels to confirm that increasing buying pressure has returned.
Bearish Continuation in a Downtrend
Bearish continuation patterns form when price trends downward, pauses, then breaks lower. Bear flags, bearish pennants, descending triangles, and bearish rectangles are common examples.
Selling pressure usually returns when price breaks below key support. The setup works best when the breakdown aligns with the previous trend and confirms that sellers still control the move.
Why the Same Shape Can Mean Different Things
Some crypto chart patterns are bilateral patterns, meaning they can break either way. A symmetrical triangle is the clearest example.
The same shape can signal continuation or reversal depending on market context. If price breaks in the opposite direction of the trend, the continuation idea fails and the setup may turn into a reversal pattern instead.
How Prior Trend Changes Pattern Interpretation
The stronger the prior trend, the cleaner the continuation reading. A sharp rally followed by a tight pause gives a better bullish continuation setup than a messy range with no clear direction.
Weak trends make patterns harder to trust. If the market trend already looks exhausted, even a textbook shape deserves extra caution.
Quick Anatomy of a Continuation Setup
To identify continuation patterns, you need to understand the parts that define them. Most setups rely on support and resistance, trendlines, pattern boundaries, volume, and the impulse move that came first.
These elements help you classify the pattern and decide whether the setup belongs in your trading strategy.
Read more: Crypto Chart Patterns Cheat Sheet
Support Level
A support level is a lower price area where buyers often step in. In continuation patterns, support helps define the bottom of the consolidation zone. You can also use support for stop-loss planning. If price breaks below support during a bullish setup, the pattern may no longer be valid.
Resistance Level
A resistance level is an upper price area where rallies often stall. In bullish setups, resistance levels mark the zone price must clear before continuation becomes more credible. In bearish setups, failed moves near resistance can show that buyers don’t have enough strength to reverse the trend.
Trendlines
Trendlines connect swing highs or swing lows to show direction, compression, or pattern boundaries. Flags often use parallel trendlines, while pennants and triangles use converging trendlines.
Some platforms use “trend lines” as two words, but the meaning is the same: they help you draw the structure price is reacting to.
Flagpole
The flagpole is the sharp move that comes before a flag or pennant. It represents the impulse move and gives the setup its directional bias. You can use flagpole length to estimate a possible profit target after the breakout. That target is only a projection, not a promise.
Pattern Boundary
Pattern boundaries are the support, resistance, or trendline edges that contain the consolidation. Price must break beyond these boundaries before the setup confirms. The cleaner the boundaries, the easier the pattern is to read. Messy, overlapping price movement usually creates weaker signals.
Volume Confirmation
Volume confirmation means trading volume fades during consolidation, then rises during the breakout or breakdown. Stronger volume suggests real participation behind the move. Low-volume breakouts are riskier. They often lack conviction and can reverse back into the pattern quickly.
The Main Continuation Patterns in Crypto
Continuation patterns are usually grouped by consolidation shape. The main families are flags, pennants, triangles, and rectangles.
A wedge pattern can also act as a continuation pattern, but it’s more context-dependent. A falling wedge is often read as bullish, while a rising wedge is often read as bearish, and both can also behave like reversal patterns depending on where they form.
Flag Patterns: The Classic Trend Pause
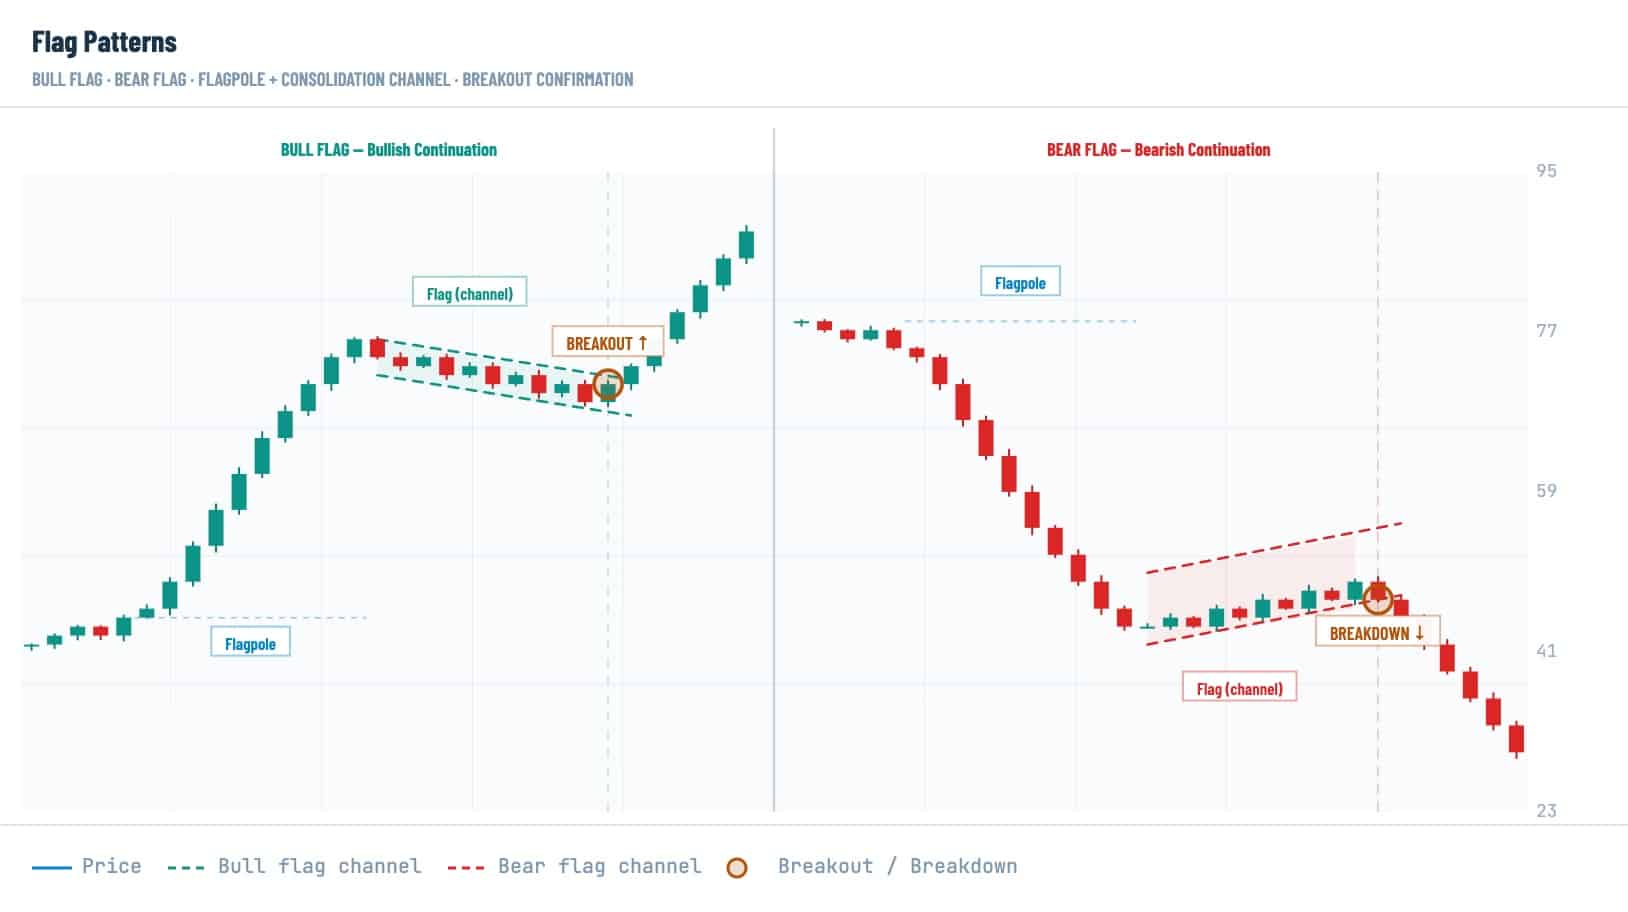
Flag patterns form after a sharp move, then consolidate in a small rectangular shape or parallel channel. They’re short, compact, and usually tilt slightly against the trend.
A bullish flag forms after an upward impulse. A bear flag forms after a downward impulse.
Flagpole: The Strong Move Before the Pause
The flagpole is the steep move that starts the setup. It shows that momentum was strong before price slowed down. The stronger and cleaner the flagpole, the easier it is to read the later consolidation as a trend pause rather than random chop.
Bull Flag: Uptrend + Pullback Channel
A bullish flag forms in an uptrend after a sharp rally. Price then pulls back inside a small downward-sloping channel. The setup confirms when price breaks above the resistance line. If the move has volume behind it, the bullish continuation signal becomes stronger.
Bear Flag: Downtrend + Relief Bounce
A bear flag forms during a downtrend after a sharp drop. Price then bounces inside a small upward-sloping channel. The setup confirms when price breaks below the lower boundary. That breakdown shows bearish continuation and suggests sellers have regained control.
Pennant Patterns: Small Triangles After Big Moves
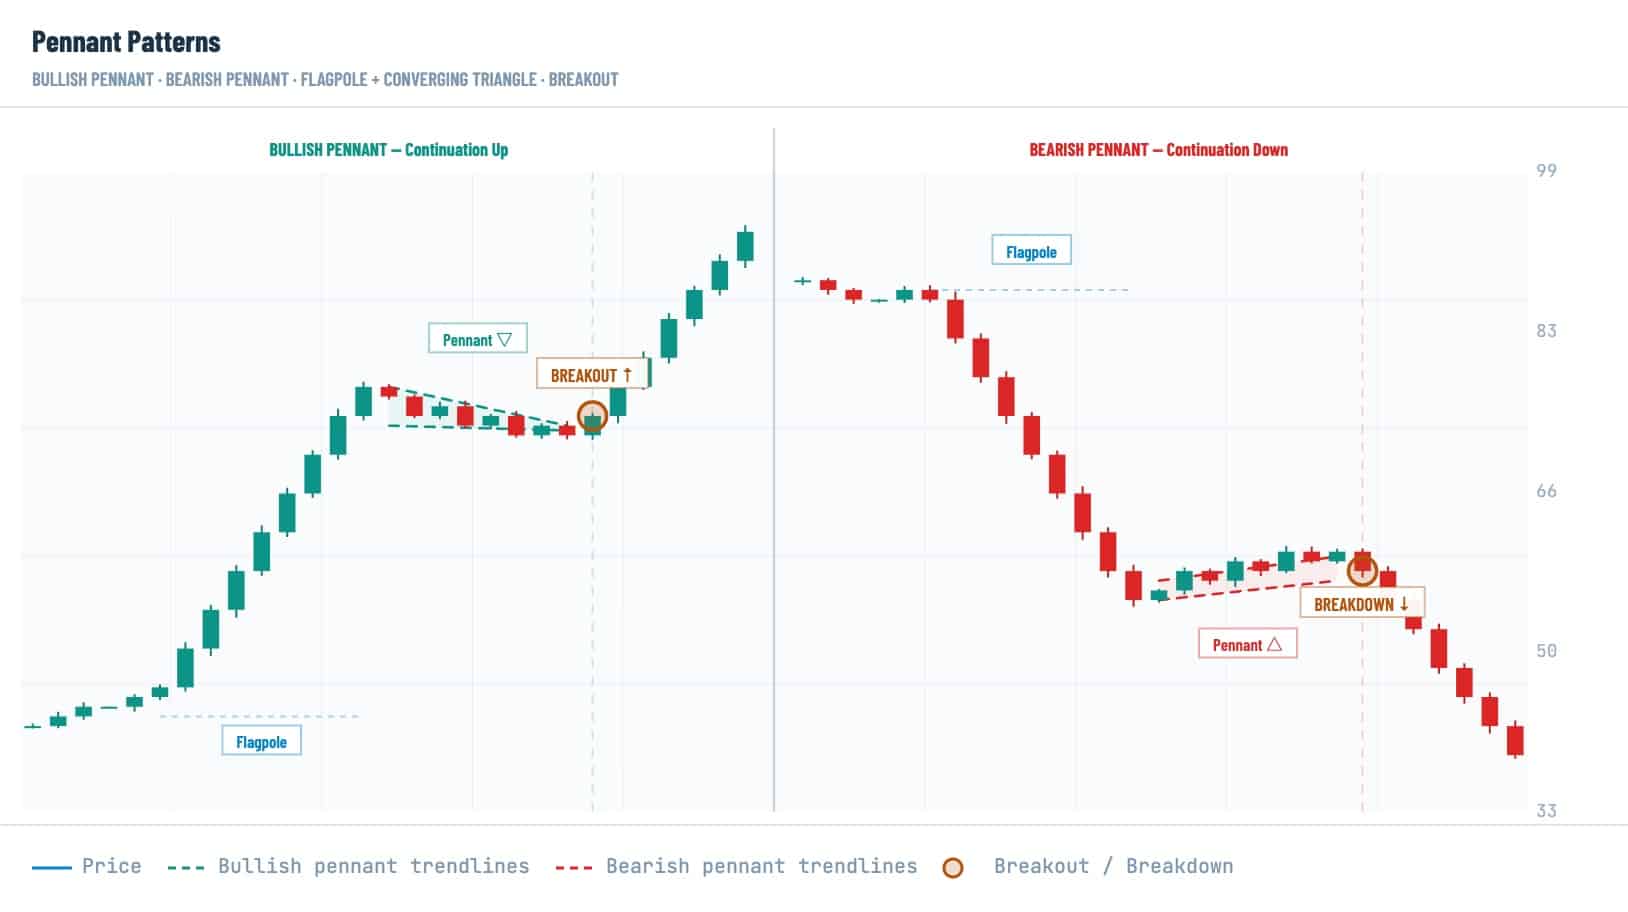
A pennant pattern also forms after a strong move, but its consolidation is triangular rather than rectangular. Price compresses between converging trendlines before breaking out. Pennants are usually short-term continuation patterns. They’re compact, quick, and often appear after fast price movement.
Bullish Pennant
A bullish pennant forms after a strong move higher. Price then compresses into a small symmetrical triangle as buyers and sellers pause. The setup confirms when price breaks upward from the triangle. You can estimate a price target by projecting the flagpole from the breakout point, but the market can always fall short.
Bearish Pennant
A bearish pennant forms after a fast move lower. Price compresses into a small triangle while bounces weaken. The setup confirms when price breaks downward. If selling pressure returns with higher volume, the bearish pennant becomes more credible.
Triangle Patterns: Ascending, Descending, and Symmetrical
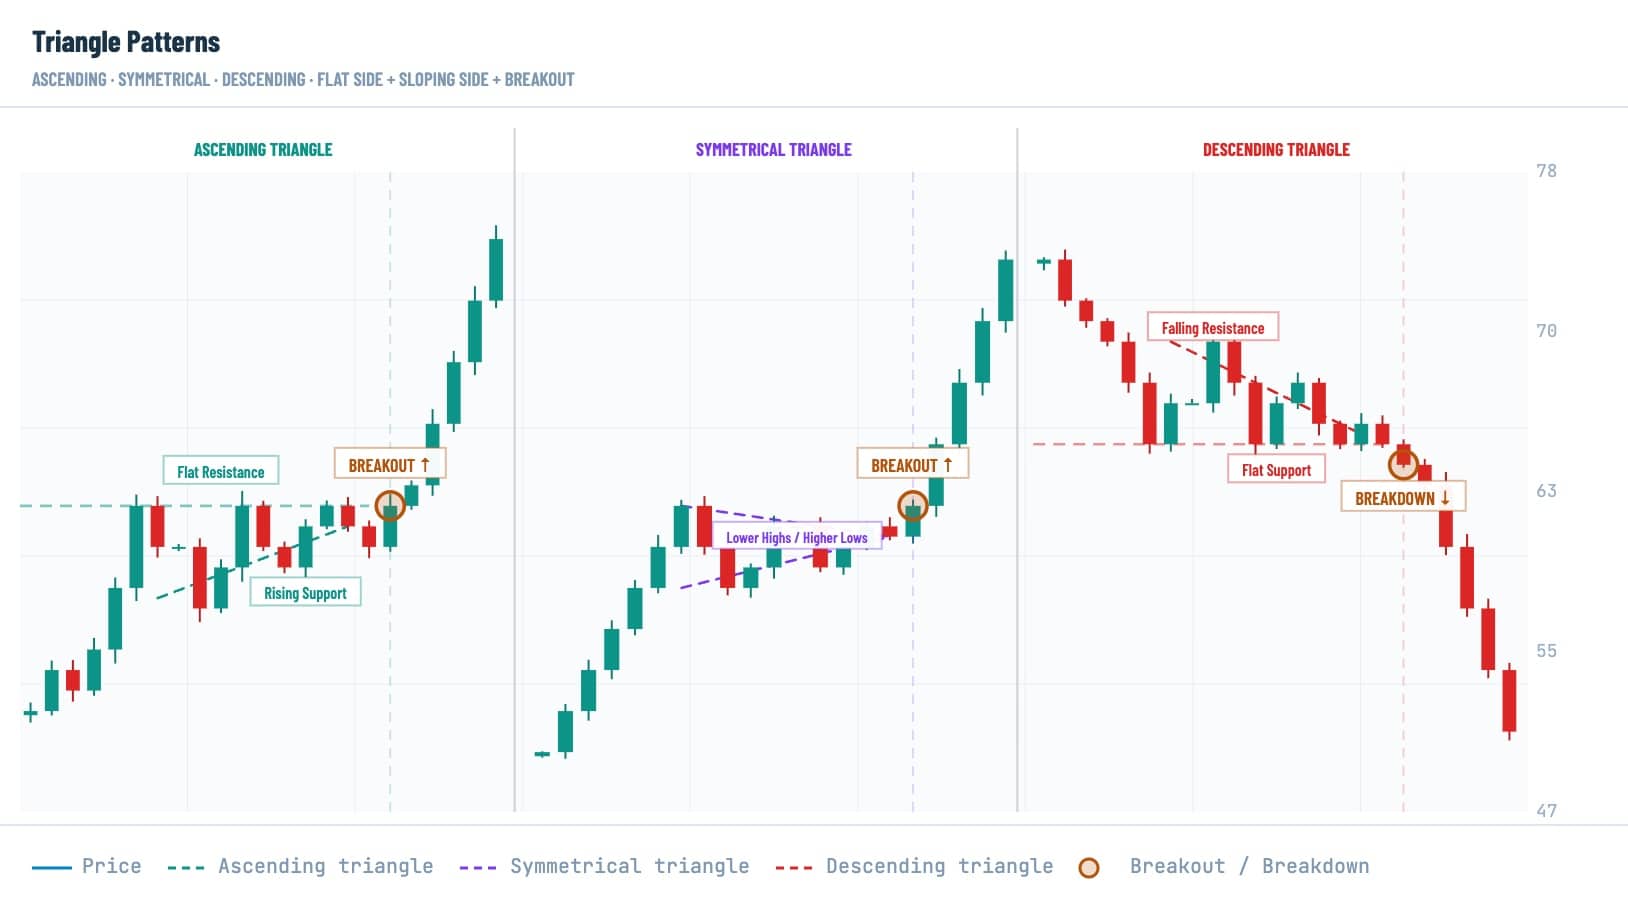
A triangle pattern forms when price compresses between converging boundaries. Triangles can take longer than flags or pennants, sometimes forming over weeks or months. Ascending, descending, and symmetrical triangle patterns can support continuation readings, but you shouldn’t assume direction before confirmation.
Ascending Triangle: Flat Resistance + Rising Support
An ascending triangle has flat resistance above and rising support below. Buyers step in at higher lows while sellers defend the same ceiling. The ascending triangle is typically bullish when it appears in an uptrend and price breaks above resistance. That breakout suggests increasing buying pressure has finally overcome supply.
Descending Triangle: Flat Support + Falling Resistance
A descending triangle has flat support below and falling resistance above. Each rally becomes weaker, which shows buyers losing strength. The descending triangle is usually bearish when it forms in a downtrend and price breaks below support. Still, it can act differently if price breaks upward instead.
Symmetrical Triangle: Compression and Indecision
A symmetrical triangle forms when lower highs and higher lows squeeze price into a tighter range. It shows indecision, not automatic continuation. The breakout direction decides the signal. If it aligns with the prevailing trend and volume rises, the continuation case becomes stronger.
Rectangle Patterns: Sideways Ranges Inside a Trend
Rectangle patterns form when price moves between clear support and resistance levels. The range shows temporary balance before the next move. A rectangle can signal continuation or reversal. Continuation is more likely when price exits the range in the same direction as the prior trend.
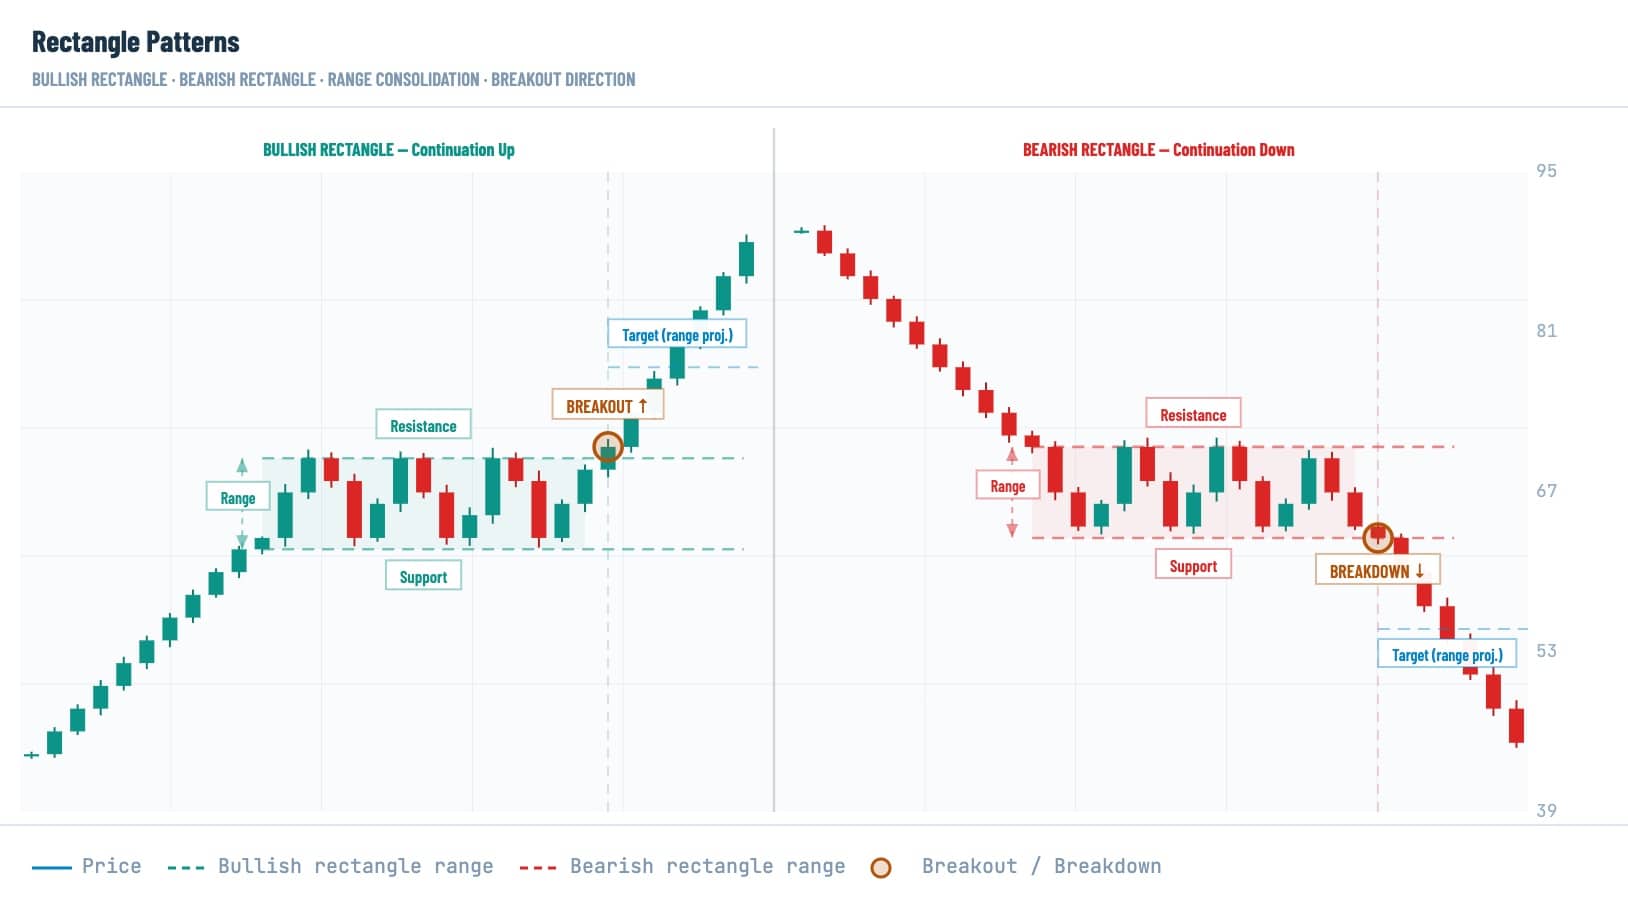
Bullish Rectangle in an Uptrend
A bullish rectangle forms after an upward move, then price consolidates sideways between flat support and resistance. Buyers defend the lower boundary while sellers cap the top. The setup confirms when price breaks above resistance. You can estimate a profit target by adding the range height to the breakout level.
Bearish Rectangle in a Downtrend
A bearish rectangle forms after a downward move, then price stalls inside a flat range. The structure looks neutral until price chooses a side. The setup confirms when price breaks below support. That breakdown signals bearish continuation and suggests the downtrend may resume.

How to Get Free Crypto
Simple tricks to build a profitable portfolio at zero cost

How to Confirm a Continuation Pattern
Confirmation means checking more than shape. You need the prior trend, clean structure, breakout or breakdown, volume, and broader market context to align.
No single checklist removes risk. It only helps you avoid weak setups and obvious traps.
1. Check the Prior Trend
First, confirm that a clear trend exists. If price is stuck in a sideways range, don’t treat every small pattern as continuation. A continuation setup works best when it follows a strong trend and forms a clear pause within that move.
2. Check the Pattern Shape
Match the structure to the right family: flag, pennant, triangle, or rectangle. Draw the main boundaries and check whether price respects them. Use measured-move logic carefully. Pattern height or flagpole length can guide a possible target, but it doesn’t guarantee the final move.
3. Wait for Breakout or Breakdown
Don’t enter just because the pattern looks familiar. Wait until price closes outside the boundary. A wick can fake you out. A decisive close gives a better signal that the market has actually chosen direction.
4. Look for Volume Confirmation
Breakouts are stronger when volume rises noticeably. A breakout without volume can fail fast. Ideally, volume fades during the pattern and expands when price breaks out or breaks down. That shift shows fresh market interest behind the move.
5. Watch for a Retest
After a breakout, price may retest the broken resistance or support level. This can help confirm whether the old boundary has flipped into a new one. A clean retest can offer a more controlled entry. If price falls straight back into the range, the setup may be failing.
6. Use Multi-Timeframe Context
Check at least one higher timeframe before acting. A short-term continuation pattern is more useful when it aligns with the broader trend. Other technical indicators can help too, but they shouldn’t replace price action. Use them as support, not as the main trigger.
Volume, Momentum, and Confirmation Tools
Technical indicators can add context to continuation patterns. They help you judge strength, momentum, and trend direction, but they don’t guarantee continuation.
- Trading volume: Rising volume at the breakout point strengthens the signal. Weak or stagnant volume raises the risk of false breakouts.
- Relative strength index:RSI helps you judge whether the market looks overextended before or after a breakout.
- MACD:MACD can show whether momentum supports the move or starts to fade.
- Moving averages:Moving averages help confirm trend direction and filter setups that run against the broader market.
- Other technical indicators:Bollinger Bands or ATR can help you understand volatility, but price action should stay at the center of your crypto trading strategy.
Risk Management for Continuation Patterns
Continuation patterns can fail even when they look clean. That’s why disciplined risk management matters more than pattern recognition alone.
Invalidation Level: The “I Was Wrong” Point
Your invalidation level is the price where the setup no longer behaves as expected. It tells you when the trade idea has failed. For bullish setups, invalidation often sits below support. For bearish setups, it often sits above resistance.
Stop Loss Placement Around Pattern Boundaries
Place your stop loss beyond the pattern boundary on the opposite side of your expected move. For a long setup, that usually means below support. For a short setup, it usually means above resistance. Your stop should match your risk tolerance. Many traders risk only a small percentage of account size per trade because crypto moves fast.
Position Sizing for Volatile Crypto Markets
Use smaller positions when volatility is high. A normal crypto wick can hit an oversized position before the larger setup has time to play out. Position sizing helps you manage risk without panicking. It also makes it easier to re-enter if the first setup fails and then resets.
False Breakouts and Fakeouts
False breakouts happen when price breaks a boundary, attracts entries, then reverses. In crypto, this can happen often because liquidity changes quickly. Waiting for a candle close and volume confirmation helps filter weak signals. It won’t remove risk, but it can keep you out of obvious low-conviction moves.
Why Low-Volume Breakouts Are Risky
A breakout on low volume often lacks real participation. Price may move beyond the boundary only because liquidity is thin. That’s especially risky on weekends or during quiet hours. If volume doesn’t confirm the move, there’s usually no reason to rush.
No Pattern Guarantees Profit
No continuation pattern guarantees a profit target. Price can reverse, stall, or fall short after an initially strong move. You can take partial profits near major levels or tighten stops as price moves in your favor. The goal isn’t certainty. It’s controlled risk.
Crypto-Specific Factors That Can Break a Continuation Pattern
Crypto has market conditions that make continuation patterns harder to trade than textbook examples suggest. These factors don’t make chart patterns useless. They just mean you need stricter confirmation.
1. 24/7 Trading and Weekend Liquidity
Crypto doesn’t have a clean daily open and close like traditional markets. Volume can thin out on weekends or during off-hours. Low liquidity can make price breaks look more meaningful than they are. Treat weak weekend breakouts with extra caution.
2. News Spikes and Sudden Volatility
Major news events can destroy a valid-looking setup in minutes. Listings, hacks, regulatory headlines, ETF news, or macro data can all override the pattern. If a big event is coming, don’t treat the chart like it exists in isolation. News risk can turn continuation into chaos.
3. Long Wicks and Exchange-Specific Price Moves
Crypto often prints long wicks that briefly cross pattern boundaries. Sometimes those moves happen on one exchange because of thin order books or local liquidity gaps. Check whether the move appears across major markets before treating it as confirmation. One ugly wick isn’t always a real breakout.
4. Leverage Cascades and Liquidation Moves
Liquidations can push price violently through support or resistance. These moves may look like breakouts, but they can reverse once forced selling or buying ends. If price moves too far too fast, wait for structure to settle. A clean continuation should show follow-through, not just a liquidation spike.
Reading a Crypto Continuation Pattern
Here’s a simple workflow you can use when reading continuation patterns. It keeps the process structured and helps you avoid emotional entries.
Step 1: Identify the Trend
Start with direction. Is price in an uptrend, downtrend, or sideways range? If there’s no clear trend, there’s no clear continuation setup. Skip it or wait for better structure.
Step 2: Find the Impulse Move
Look for the strong price movement that came before the pause. It should stand out on the chart. That impulse gives the setup its bias. A weak push usually creates a weaker pattern.
Step 3: Draw Support, Resistance, or Trendlines
Mark the key support and resistance levels or draw the trendlines that contain the pattern. These boundaries define the setup. Use parallel lines for flags and rectangles. Use converging trend lines for pennants and triangles.
Step 4: Classify the Pattern
Decide whether the structure is a flag, pennant, triangle, rectangle, or context-dependent wedge. Don’t overcomplicate it. Classification helps you choose the right measurement logic. Flags and pennants often use flagpole length, while rectangles use range height.
Step 5: Wait for Confirmation
Wait until price closes outside the pattern boundary. Don’t act while price is still trapped inside the range. A pattern is only a potential setup before confirmation. Patience keeps you from chasing noise.
Step 6: Check Volume
Look for stronger volume when price breaks out or breaks down. Real participation makes the signal more credible. If volume stays flat, the move may be a fakeout. Let the market prove itself.
Step 7: Define Target and Stop Loss
Set a possible profit target using the flagpole or pattern height. Then set your stop loss around the invalidation level. Both numbers should be clear before entry. If you can’t define them, the setup isn’t ready.
Step 8: Decide Whether the Risk/Reward Makes Sense
Compare your possible reward with your possible loss. If the stop is too wide or the target is too close, pass. A good crypto trading strategy doesn’t need constant entries. It needs setups where the risk makes sense.
Comparison Table: Flags vs. Pennants vs. Triangles vs. Rectangles
Flags and pennants are the easiest to confuse. Both need a strong prior move, but flags use a small channel with parallel boundaries. Pennants compress into a small triangle with converging lines.
Final Thoughts
Continuation patterns help you read trend pauses without panicking at every pullback. They work best when the trend is clear, the structure is clean, and volume supports the breakout. Still, they’re only probabilities. Use them with confirmation, stop losses, and realistic targets.
If the setup looks weak, skip it. Crypto will always give you another chart.
FAQ
Are continuation patterns reliable in crypto?
Continuation patterns can be useful, but they’re not always reliable. They work better with a clear trend, strong volume, and strict confirmation.
Which continuation pattern is easiest to spot?
The flag pattern is usually the easiest to spot. It has a sharp flagpole followed by a small channel that tilts against the trend.
Can a continuation pattern turn into a reversal?
Yes, if price breaks in the opposite direction of the expected move, the continuation setup fails and may become a reversal signal.
Do continuation patterns work on short timeframes?
Yes, but short timeframes have more noise and more false signals. Use stricter confirmation, smaller position sizes, and clear stop losses.
Disclaimer: Please note that the contents of this article are not financial or investing advice. The information provided in this article is the author’s opinion only and should not be considered as offering trading or investing recommendations. We do not make any warranties about the completeness, reliability and accuracy of this information. The cryptocurrency market suffers from high volatility and occasional arbitrary movements. Any investor, trader, or regular crypto users should research multiple viewpoints and be familiar with all local regulations before committing to an investment.
The post Crypto Continuation Patterns: Flags, Pennants & More appeared first on Cryptocurrency News & Trading Tips – Crypto Blog by Changelly.
